Future dietary exposure scenarios
A calculation of the dietary exposure (concentrations of POPs and heavy metals in food items and the results of the dietary questionnaires) for the people included in the Norwegian Fish and Game study were conducted. Oily fish was the main contributor to PCBs, dioxins, ΣPBDEs and HBCD (Knutsen et al., 2008, Kvalem et al., 2009). For the perfluorinated compounds PFOA, PFUnDA and PFOS, the combined intake of fish and shellfish was the largest contributor to the total intake. Seafood contributed to around 95 percent of the total mercury exposure (Jenssen et al., 2012).
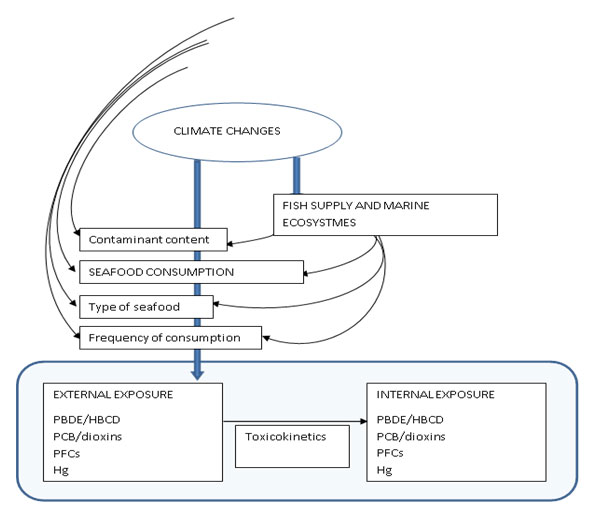
Results from both ArcRisk and the CLEAR project indicate that the impact of climate change on contaminant concentration in food is expected to be relatively low. Regarding future contaminant exposure due to climate change the impact of changes in contaminant concentrations in food will be small relative to the impact of changes in dietary behaviour. The influence of climate changes on future contaminant exposure from food will to a large degree depend on the consumption of fish and type of fish (white or farmed fish) and other seafood. A simplified causal diagram of how climate change is related to contaminant exposure via seafood consumption is shown in the figure below.

The expected change in contaminant concentrations in foodstuff was assessed with the use of models for the abiotic environment. For PCBs, it has been concluded that although the relative increases due to climate change were found to be significant, the absolute concentrations by the end of the 21st century are several orders of magnitude below the present levels. Thus, in terms of exposure, the climate change effect can be considered of minor importance. The future risk of exposure will on the contrary depend to a large degree on nutrition transition and food supply.
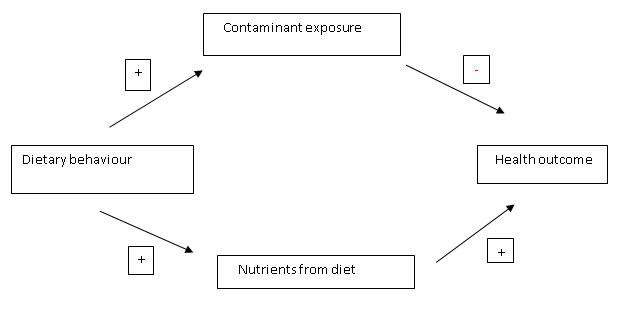
Although fish and seafood is a major contributor to contaminant exposure they also have many benefits in the diet. Separating the risk and benefits of seafood intake has been shown to be very difficult due to negative confounding, as illustrated in a simplified directed graph below.


