Emissions and pathways mercury
Current and future emissions
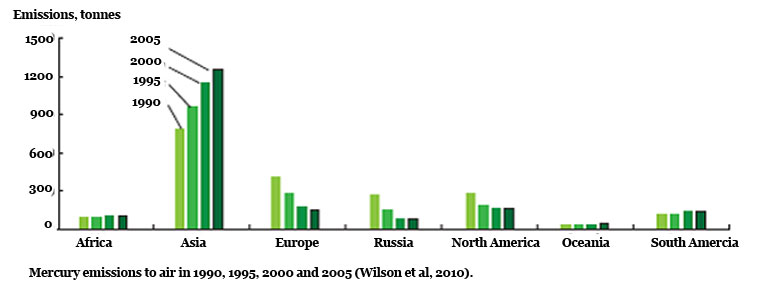
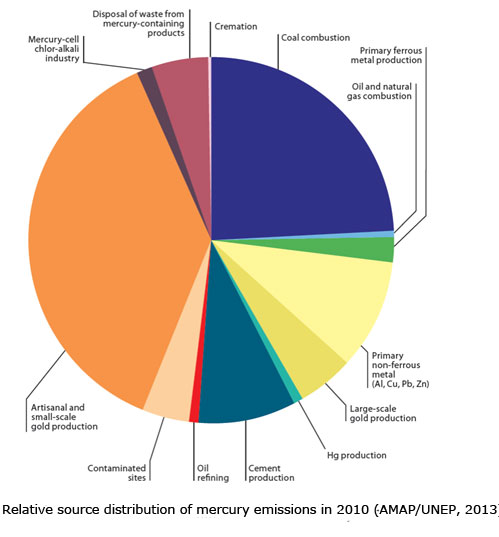
Estimated mercury emissions to air in different continents/regions from 1990, 1995, 2000 and 2005 are presented in the figure below, and show that the emissions have increased in Asia, but decreased or not changed in Europe. (AMAP, 2010). The relative contribution from global anthropogenic emissions of mercury to air 2010 is shown in figure below. (AMAP/UNEP, 2013).
Whether mercury emissions will continue to increase in the future depend on a number of variables, including the development of national and regional economies, development and implementation of technologies for reducing emissions, possible regulatory changes, and also factors associated with global climate change.
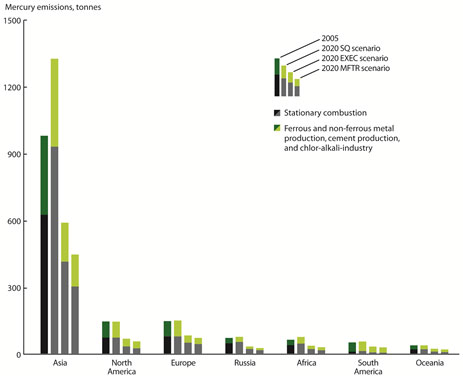
As a first attempt to gain insight into the possible implications for global anthropogenic emissions of mercury to the atmosphere of taking (additional) actions versus not taking (additional) actions to control emissions, Pacyna et al. (2010) considered three emissions scenarios for a target year of 2020:
- The ‘Status Quo’ (SQ) scenario assumes that current patterns, practices, and uses that result in mercury emissions to air will continue. Economic activity is assumed to increase in various regions; however, emission control practices remain unchanged from those currently employed, leading to increased emissions from several sectors.
- The ‘Extended Emissions Control’ (EXEC) scenario assumes economic progress at a rate reflecting the future development of industrial technologies and emissions control technologies; that is, mercury-reducing technologies currently generally employed throughout Europe and North America would be implemented elsewhere. It further assumes that emissions control measures currently committed to in Europe to reduce mercury emissions to air or water would be implemented throughout the world. These include certain measures adopted under the LRTAP Convention Heavy Metals Protocol, EU Directives, and also agreements to meet IPCC Kyoto targets on reduction of greenhouse gases causing climate change (which will also result in reductions in mercury emissions).
- The ‘Maximum Feasible Technological Reduction’ (MFTR) scenario assumes implementation of all available solutions/measures, leading to the maximum degree of reduction of mercury emissions and mercury discharges to any environment; cost is taken into account but only as a secondary consideration.
The emission scenario results for by-product emissions are illustrated in the figure below. As is shown in the figure, emissions can continue to increase, or start to decrease, depending on the future development.
A relatively modest reduction of deposition is expected for the Arctic from emission control equipment as these installations effectively control emissions of particulate and Hg2+ forms that tend to deposit close to the emission source. The Arctic reduction is expected to occur from reduction of long- range transport of Gaseous Elemental Mercury (GEM). The major effect of the emission reductions under the scenarios are likely to occur in South- East Asia.
It was concluded in the ArcRisk project that the implementation of various international regulations along various climate change scenarios, including the IPCC scenarios, would decrease global emissions of mercury, particularly mercury emissions from fossil fuel combustion in the Northern Hemisphere, even by 40% in the year 2020 compared to the 2005 emission levels (Pacyna et al., 2010). As the spatial distribution of the mercury emission scenarios in the year 2020 is also available on a global scale, the models calculated that reductions of mercury deposition of up to 20% can be expected in the Arctic due to the above-mentioned reduction of emissions of this contaminant in the year 2020 (Pacyna et al., 2011).
Models of Mercury
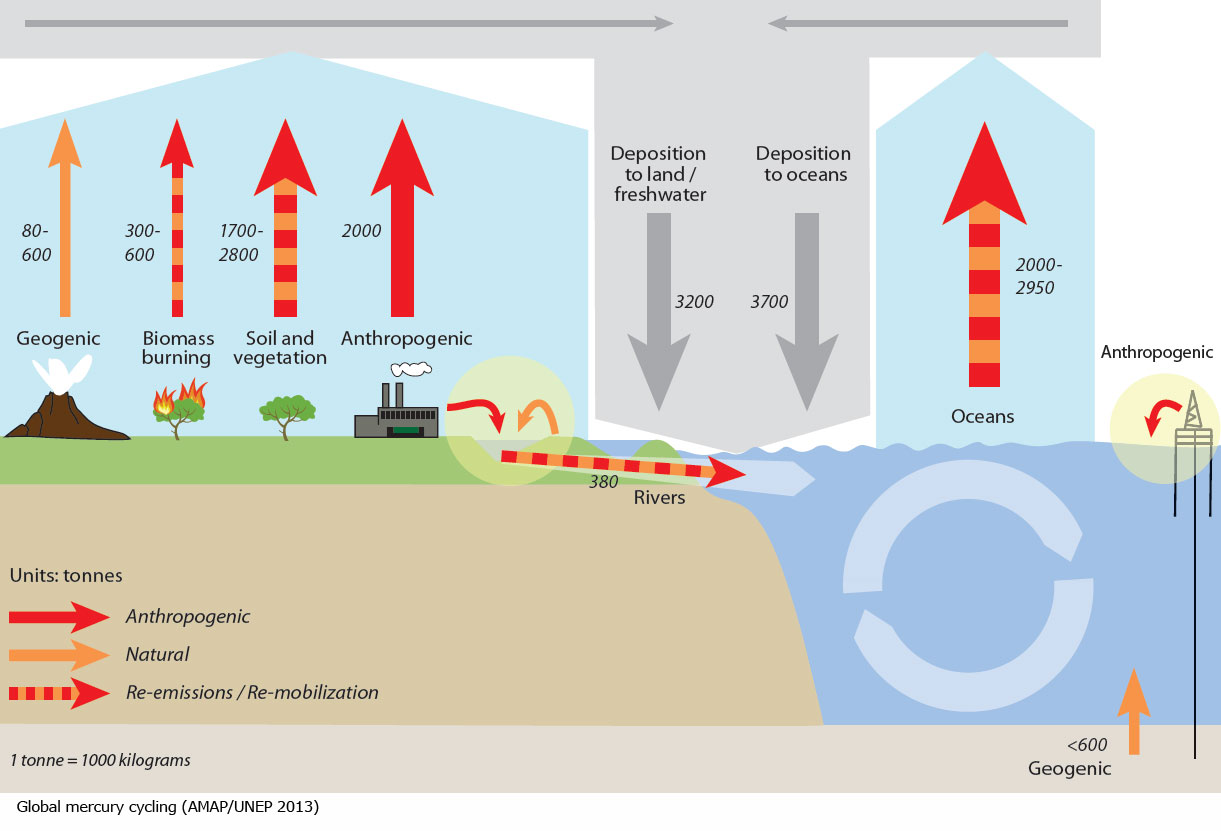
Various air transport models have simulated that mercury leading to contamination in the Arctic today originates from outside the region, mainly from sources in the Northern Hemisphere (Europe and North America) and from East- and South Asia. The figure below, illustrates the global mercury cycling (figure from AMAP/UNEP 2013).
DEHM model
The DEHM model has been applied to analyse the influence of climate change on the atmospheric transport and deposition of mercury in time-slice experiments, by using climate meteorological data from ECHAM5/MPI-OM (SRES A1B scenario) for two different decades, 1990–1999 and 2090–2099.
The results from this modelling indicates higher mercury deposition over continental areas in the Arctic and near-Arctic under a climate change scenario compared to present-day climate and lower deposition rates directly to the Arctic Ocean. The changes in mercury deposition are driven by changes in the atmospheric chemistry of mercury that result from reduced sea-ice cover and increased concentrations of ozone in the troposphere that are forecast under the climate change scenario.
By comparing the mean values for a whole decade with the standard variations of the annual values, it is possible to see whether the difference in concentrations and depositions between two decades is significant compared to the year-to-year variations. In the figure below, the total annual mean deposition of mercury for 1990–1999 and the t-test statistic, indicating the statistical significance of the changes between the 1990–1999 time slice and the 2090–2099 time slice, is shown. The results produced with the DEHM model system indicate that the total deposition of mercury will decrease over the marine areas due to altered ice cover under a future climate, but deposition over land areas will increase.
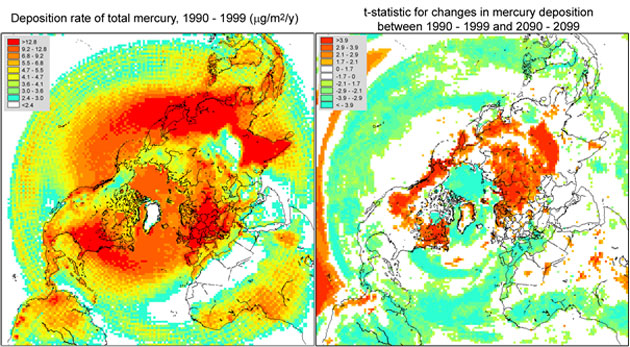
The deposition of mercury directly to the Arctic Ocean is lower by 20 to 40 percent in the 2090–2099 time slice compared to the 1990–1999 time slice. The difference is due to changed ice cover and its influence on atmospheric mercury depletion events in the DEHM model. Deposition over the continents is higher by 20 to 40 percent. One of the reasons for the increase over the continents is due to a significant increase in the ozone concentrations in the troposphere. Ozone is one the main oxidant path of mercury in the DEHM model.

